As more and more people take up cycling, cycle paths are becoming increasingly popular, which is a positive development: cycling is a healthy, sustainable, and efficient mode of transport. There are, however, some inherent risks to this development: paths that are too crowded give rise to the possibility of unsafe situations, reduced traffic flows, and inconvenience to cyclists. CROW-Fietsberaad – the Dutch Bicycle Council – has therefore asked DTV Consultants to conduct research into how cyclists perceive road traffic intensity and bicycle lane width. Based on the findings of our research, CROW aims to adjust its recommendations for desired bicycle path dimensions in its Bicycle Traffic Design Guide.
Our research consisted of three main elements:
- Model-based calculations of the inconvenience as experienced by cyclists
- Empirical research into the use of bicycle paths and how cyclists experience these paths
- Determining the desired bicycle path dimensions
Model calculations: when do cyclists start experiencing discomfort?
We have created a calculation model, which we have named the Encounter Predictor. Users of our calculation tool can input the number of cyclists and moped riders in each direction as well as the speed distribution and use it to determine the number of possible encounters (e.g. overtaking/meeting traffic) per road user type. Based on the physically required width for each encounter, we can then determine whether such an encounter is (theoretically) possible. Inputting the dimensions of the cycle path provides further insight into the number and types of possible encounters (spacious, tight, impossible).
Empirical research: survey and results
At 15 locations throughout the Netherlands, we interviewed cyclists for three hours. At six of these locations, cyclists were surveyed twice. Cyclists were asked to give their opinion on their cycling experience that day and how they felt about the bicycle path dimensions. Alongside conducting the surveys, we also accurately checked and established how cyclists were using these paths in order to establish a connection between the results of the survey, the bicycle path dimensions, and how these paths are actually used. This method brought about a number of striking results and insights:
- The overall scores awarded to bicycle paths were considerably higher than the overall scores that were awarded to bicycle streets/advisory bicycle lanes. Thus, there appears to be a direct correlation between the absence of motorised traffic on bicycle paths and cyclist satisfaction.
- The correlation between the answers shows that the following three statements account for 48% of the variance in the average reported satisfaction scores: “This section of the bicycle path is safe”, “This bicycle path is wide enough to accommodate all cyclists”, and “This bicycle path is too crowded”.
- There appears to be no significant relationship between the reported levels of cyclist satisfaction and the dimensions of the cycle path. There also appears to be no correlation between the way cyclists judged the width of the bicycle path and its actual width. This is somewhat unsurprising, as these dimensions only matter in relation to road traffic intensity.
- There appears to be a clear correlation between the intensity of road traffic (i.e. how crowded the bicycle path is) and the reported level of cyclist satisfaction. High road traffic intensity results in lower reported levels of satisfaction.
Green, yellow and red encounters
The dimensions of the cycle path determine whether there is sufficient available space for each type of encounter: higher intensities, for obvious reasons, always result in more encounters. Narrow bicycle paths often result in impossible – or red – encounters, often to the detriment of cyclists. By analysing the average hourly road traffic intensity, our Encounter Predictor can effectively calculate the number of encounters that provide sufficient space for all road users (“green encounters”), the number of encounters that provide limited space for all road users (“yellow encounters”), and the number of encounters that do not provide sufficient space for all road users (“red encounters”).
Reliably predicting cyclist satisfaction
We have examined the extent to which the number of green, yellow and red encounters correlates with the reported levels of cyclist satisfaction. As it is possible that encounters with moped riders may have a demonstrable impact on how cyclists rate their journey due to their respective speed differences (and possibly the difference in noise levels), the figures on these encounters have been broken down separately. We have concluded that the model that best predicts cyclist satisfaction must include the following variables:
- The total percentage of mopeds/light-moped riders
- The number of green + yellow encounters (per hour and per kilometre)
- The number of red encounters per cyclist (per hour and per kilometre)
These variables account for 48% of the variance in the average reported satisfaction scores. This is a fairly high explanatory variable, especially considering the fact many other factors (such as weather conditions and environmental factors) can influence cyclist satisfaction.
Visual representation of cyclist satisfaction plotted against bicycle path width
We have incorporated a calculation tool into our Encounter Predictor that can be used to calculate whether a bicycle path will be awarded a score of below average, average, or above average. Variables such as road traffic intensity, bicycle path width, and the speed distribution of cyclists/moped riders can be inputted into the tool.
The graph below illustrates the interactions between these variables on two-way bicycle paths. In this figure, the y-axis represents the bicycle path width, while the x-axis represents the road traffic intensity per hour. The lines indicate the upper limit values of the categories “below average”, “average” and “above average” and depict the different percentages of moped/light moped riders. To be awarded an “average” score, the cycle path width must exceed the line representing “below average” on this line graph.
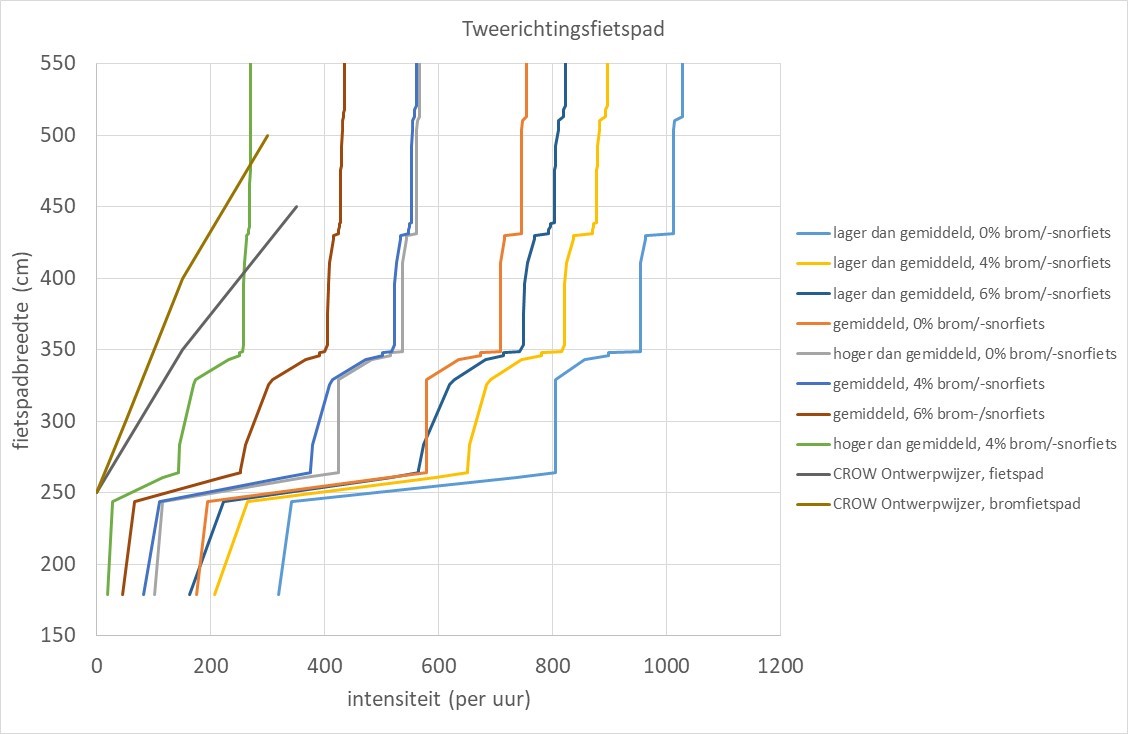
Current requirements may be more stringent than strictly necessary
The graph above also shows the bike path dimensions as recommended by the CROW Design Guide for Bicycle Traffic and demonstrates that the current guidelines are more stringent than needed. As of yet, CROW has argued it is too early to adjust its recommendations but has acknowledged that our findings, which will likely be included in its follow-up manual, warrant further consideration.
Hubspot content can't be displayed because the use of tracking cookies is not permitted.